
How Pulsyn Calculates Your Sleep Score: A Transparent Look at Our Algorithm
Introduction: Why Transparency Matters
When you wake up to a "73 sleep score," do you actually know what that number means? Most health tracking companies treat their algorithms as proprietary black boxes. We don't think that's good enough. You deserve to know exactly how your health metrics are calculated, and why we made the choices we did.
This post covers our sleep scoring algorithm in full, from raw sensor data to the final number in the app. Whether you're a data nerd, a sleep optimization enthusiast, or just curious about how your ring works, here's how it all fits together.
Part 1: How We Detect Sleep Stages
The Hardware Foundation
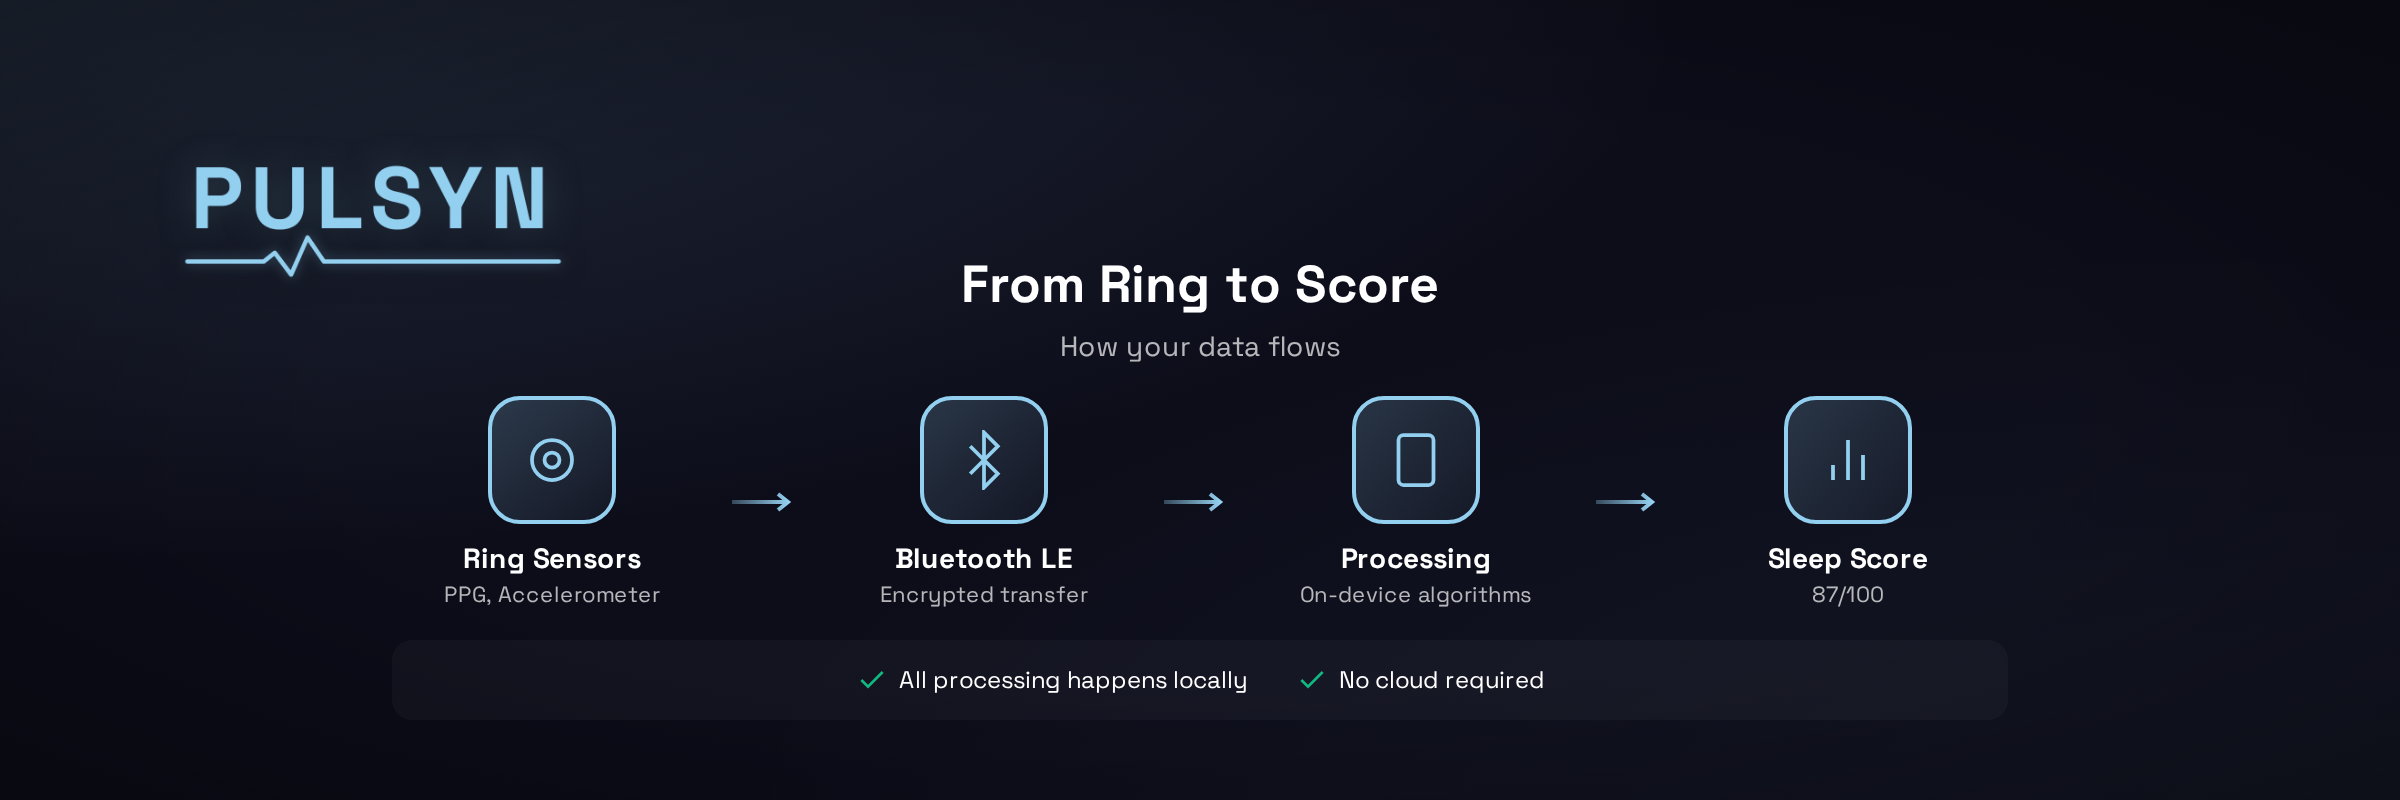
Your Pulsyn ring uses two primary sensors for sleep tracking:
- Photoplethysmography (PPG): A green LED measures blood flow changes to derive heart rate and HRV.
- 3-axis Accelerometer: Tracks movement and position changes throughout the night.
Both sensors sample continuously while you sleep, building a minute-by-minute record of your physiological state.
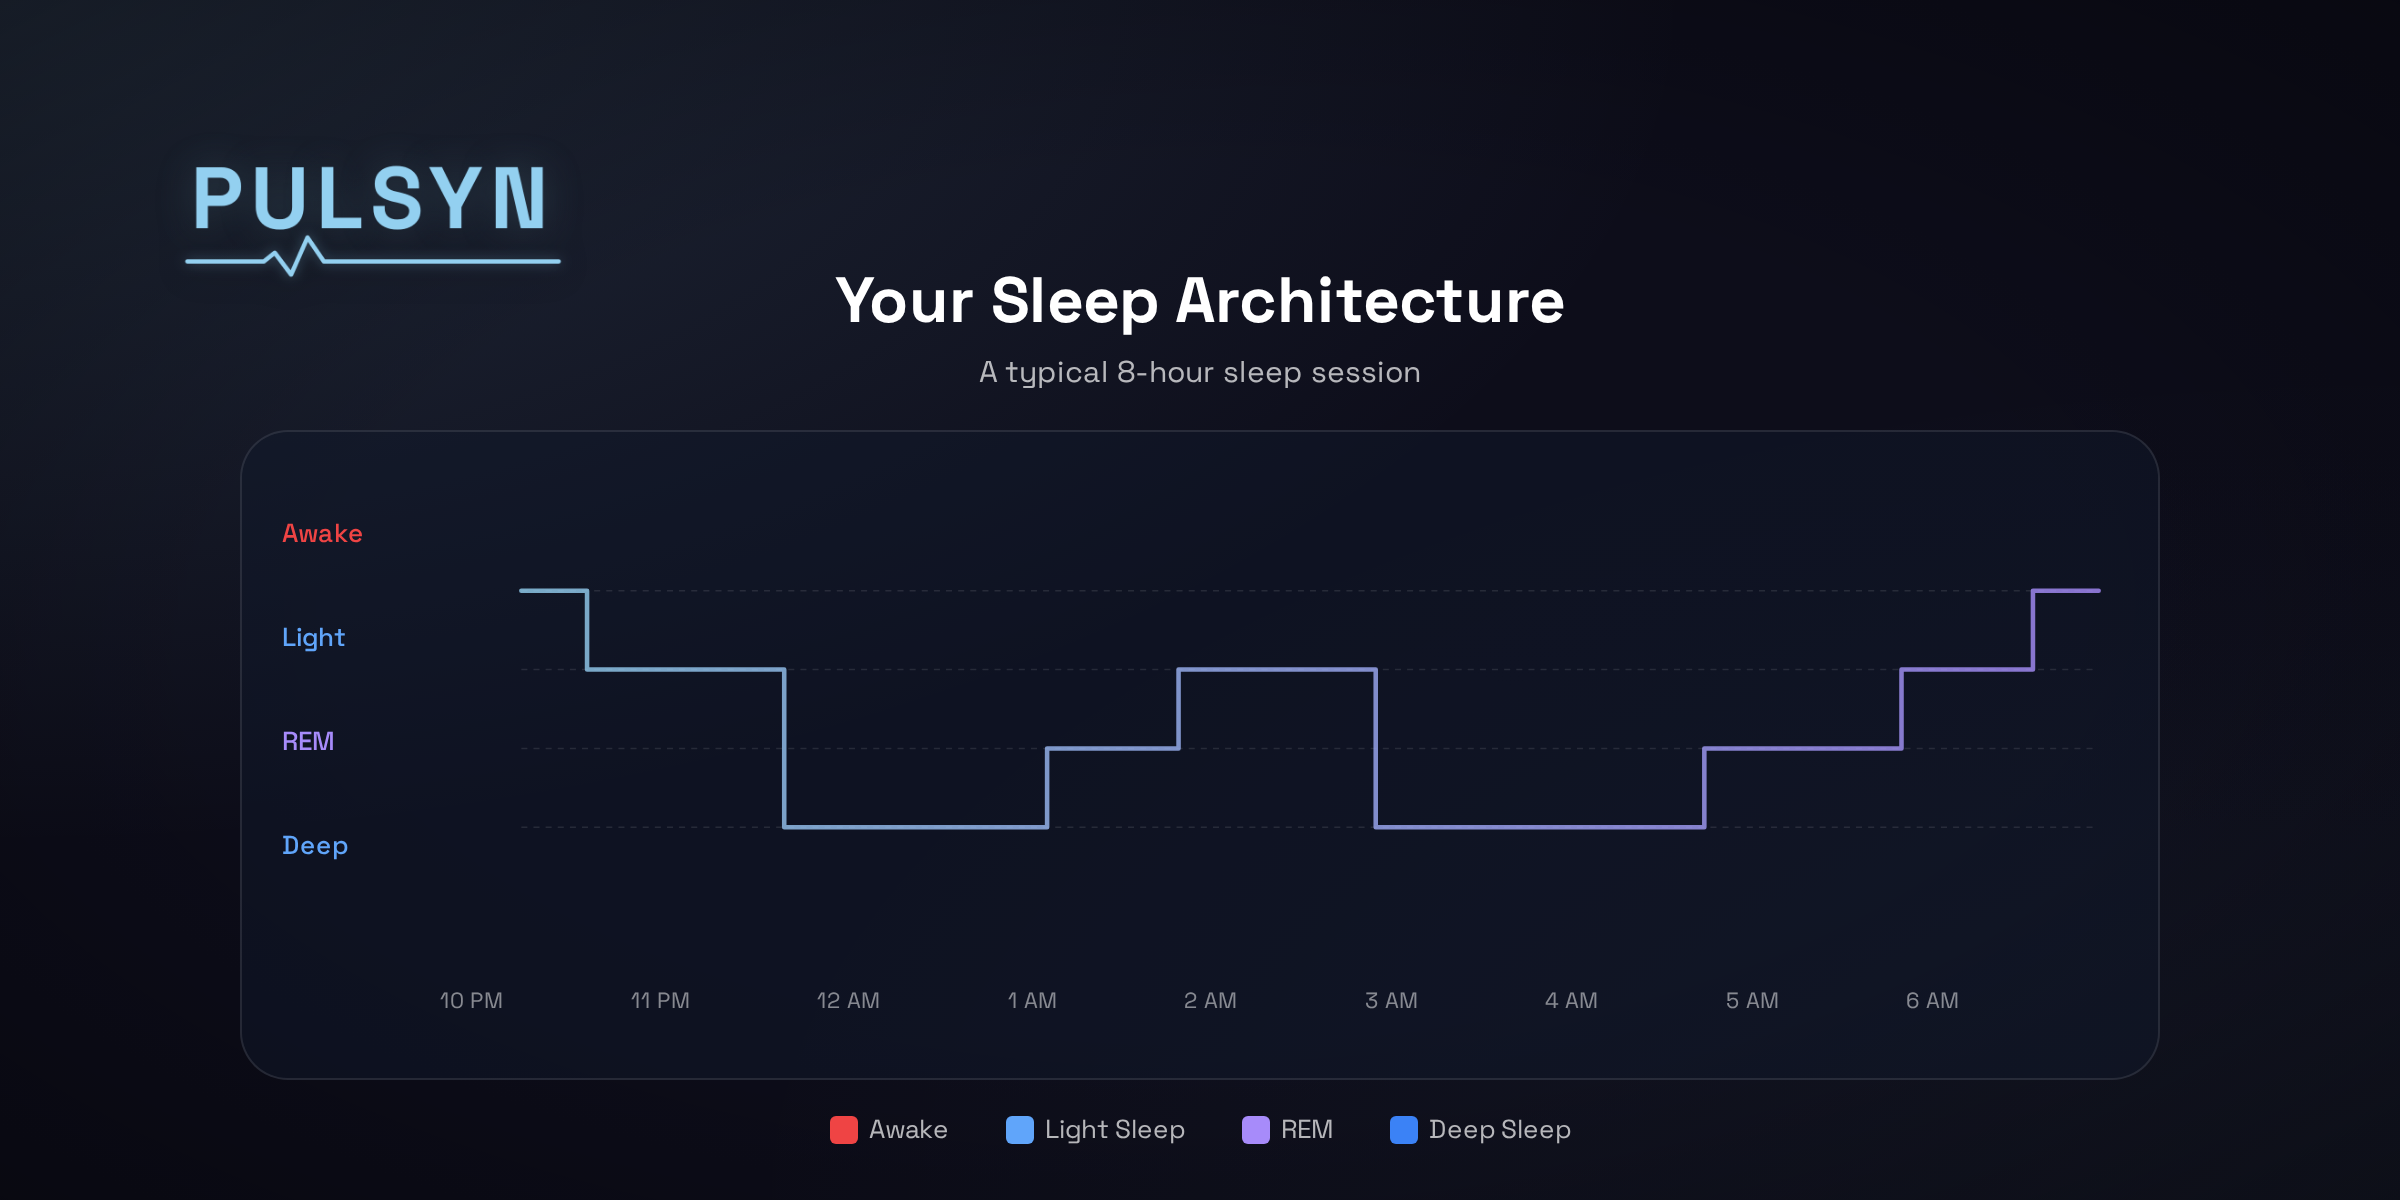
The Four Sleep Stages
Human sleep cycles through four distinct stages:
| Stage | Characteristics | Typical % of Night |
|---|---|---|
| Awake | Conscious, movement, high HR variability | 5-10% |
| Light Sleep | Decreased HR, reduced movement | 45-55% |
| Deep Sleep | Lowest HR, no movement, restorative | 15-25% |
| REM Sleep | Rapid eye movement, vivid dreams, muscle paralysis | 20-25% |
Our Classification Algorithm
Pulsyn uses a multi-signal approach that combines:
Sleep Stage = f(Movement, Heart Rate, HRV, Time of Night, Previous Stage)Movement Detection:
- Awake: Frequent position changes
- Light: Occasional small movements
- Deep: Nearly motionless
- REM: Motionless, but heart rate variability increases
Heart Rate Patterns:
- Deep sleep: HR drops 15-30% below waking baseline
- REM: HR rises closer to waking levels
- Transitions: Gradual changes between stages
Time Context:
- Deep sleep dominates the first half of the night
- REM periods lengthen in the second half
- Sleep cycles average 90 minutes
State Transition Logic: You can't jump directly from deep sleep to awake. The algorithm enforces physiologically valid transitions (e.g., Deep → Light → Awake).
Validation Against Gold Standard
Our sleep staging algorithm has been validated against polysomnography (PSG), the clinical gold standard that uses EEG brain wave monitoring. We can't match EEG precision (it directly measures brain activity), but our multi-sensor approach achieves:
- Overall accuracy: 85-90% for 4-stage classification
- Deep sleep detection: 88-92% accuracy
- Wake detection: 90-95% accuracy
- REM detection: 80-85% accuracy (the hardest stage to detect without EEG)
We're upfront about these limitations: wrist and finger-worn trackers cannot match EEG precision. For daily trend tracking and recovery optimization, though, our accuracy is more than sufficient.
Part 2: The Sleep Score Formula
Breaking Down the Components
Your final sleep score (0-100) is calculated from five weighted components:
Sleep Score = (Duration × 0.40) + (Efficiency × 0.25) + (Deep % × 0.20) + (REM % × 0.15)Each component is explained below.
1. Sleep Duration Score (40 points)
The Problem with "7-9 Hours for Everyone"
Most trackers penalize you for sleeping outside a fixed 7-9 hour window. That approach ignores real individual variation:
- Some people are genetically short sleepers (6 hours)
- Athletes in heavy training may need 9-10 hours
- Older adults naturally sleep less
Our Personalized Approach
Pulsyn calculates your optimal sleep duration from 30 days of your own historical data:
// From readiness_service.dart lines 277-303
if (durationBaseline != null) {
  final deviation = (actualHours - baselineHours).abs();

  if (deviation <= 0.5) {
    score += 40;  // Within 30 minutes of YOUR optimal
  } else if (deviation <= 1.0) {
    score += 30;  // Within 1 hour
  } else if (deviation <= 1.5) {
    score += 20;  // Within 1.5 hours
  } else {
    score += 10;  // More than 1.5 hours away
  }
}
Example:
- Your baseline: 7.5 hours (calculated from your history)
- Last night: 7 hours 15 minutes
- Deviation: 15 minutes = 0.25 hours
- Score: 40/40 points ✅
If a competitor's algorithm docked you for not hitting 8 hours, you'd lose points on a night you were perfectly rested for your body.
2. Sleep Efficiency Score (25 points)
Formula:
Efficiency = (Time Asleep / Time in Bed) × 100This measures how much of your time in bed was actual sleep.
Scoring:
- ≥90% efficiency: 25 points (excellent)
- 85-90%: 20 points (good)
- 80-85%: 15 points (fair)
- <80%: Scaled down proportionally
Sleep efficiency is one of the few metrics where population norms hold up well. Values below 85% typically indicate fragmented sleep regardless of individual variation.
Example:
- Time in bed: 8 hours (480 minutes)
- Time asleep: 7.5 hours (450 minutes)
- Efficiency: 450/480 = 93.75%
- Score: 25/25 points ✅
3. Deep Sleep Percentage (20 points)
Deep sleep (slow-wave sleep) is when your body handles heavy physical repair:
- Muscle recovery
- Immune system strengthening
- Hormone regulation (growth hormone, cortisol)
The Personalized Difference
Population averages put normal deep sleep at 15-25%. In practice, we've observed a wider range:
- Young adults (18-25): Often 18-25% deep sleep
- Athletes: Can hit 25-30% after hard training
- Older adults (50+): May drop to 10-15% (still healthy!)
Our algorithm compares your deep sleep percentage to your own historical average using Z-scores:
// From readiness_service.dart lines 322-336
final zScore = deepSleepBaseline.zScore(todayDeepPercent);

if (zScore.abs() <= 0.5) {
  score += 20;  // Within 0.5 SD of YOUR norm
} else if (zScore.abs() <= 1.0) {
  score += 15;  // Within 1 SD
} else if (zScore.abs() <= 1.5) {
  score += 10;  // Within 1.5 SD
} else {
  score += 5;   // More than 1.5 SD away
}
Example:
- Your average deep sleep: 22% (from 30-day history)
- Last night: 21%
- Z-score: -0.2 (very close to your norm)
- Score: 20/20 points ✅
4. REM Sleep Percentage (15 points)
REM (Rapid Eye Movement) sleep is critical for:
- Memory consolidation
- Emotional processing
- Learning and creativity
Personalized REM Scoring
REM percentages vary by individual, same as deep sleep. We use the same Z-score approach:
// From readiness_service.dart lines 352-366
final zScore = remSleepBaseline.zScore(todayRemPercent);

if (zScore.abs() <= 0.5) {
  score += 15;  // At your personal norm
} else if (zScore.abs() <= 1.0) {
  score += 12;
} else {
  score += 8;   // Significantly different from norm
}
Why REM gets lower weight (15 points) vs Deep (20 points)?
Research shows deep sleep has a stronger correlation with physical recovery and next-day readiness. REM matters for cognitive function but tracks less directly with physical performance metrics.
Part 3: Sleep Debt Tracking
The Multi-Night Problem
One good night of sleep doesn't erase three nights of poor sleep. Your body accumulates sleep debt that persists for days.
Our Sleep Debt Algorithm:
// From sleep_debt_service.dart
Cumulative Debt = Σ(Optimal Duration - Actual Duration) over last 7 days
Example Sleep Week:
| Day | Optimal | Actual | Debt |
|---|---|---|---|
| Mon | 7.5h | 6h | -1.5h |
| Tue | 7.5h | 6.5h | -1.0h |
| Wed | 7.5h | 8h | +0.5h (partial payback) |
| Thu | 7.5h | 7h | -0.5h |
| Fri | 7.5h | 5.5h | -2.0h |
| Sat | 7.5h | 9h | +1.5h (payback) |
| Sun | 7.5h | 7.5h | 0h |
Cumulative debt: -3.0 hours
How Debt Affects Your Score
Sleep debt creates a penalty of 0 to -50 points applied to your sleep score:
// From readiness_service.dart lines 382-384
final cumulativeDebt = await _sleepDebtService.getCumulativeDebt(userId);
final debtPenalty = _sleepDebtService.getReadinessImpact(cumulativeDebt);
score += debtPenalty;  // debtPenalty is negative
Penalty Scale:
- 0-2 hours debt: -5 to -10 points
- 2-4 hours debt: -10 to -20 points
- 4-6 hours debt: -20 to -35 points
- 6+ hours debt: -35 to -50 points
This way your score reflects not just last night, but your broader sleep health over the week.
Part 4: Real-World Example
Here's a complete calculation with real numbers:
User Profile:
- Personal optimal duration: 7.5 hours
- Average deep sleep: 22%
- Average REM sleep: 23%
Last Night's Data:
- Time in bed: 8 hours
- Time asleep: 7 hours 20 minutes
- Deep sleep: 95 minutes (21.5%)
- REM sleep: 105 minutes (23.9%)
- Cumulative sleep debt: -1.5 hours
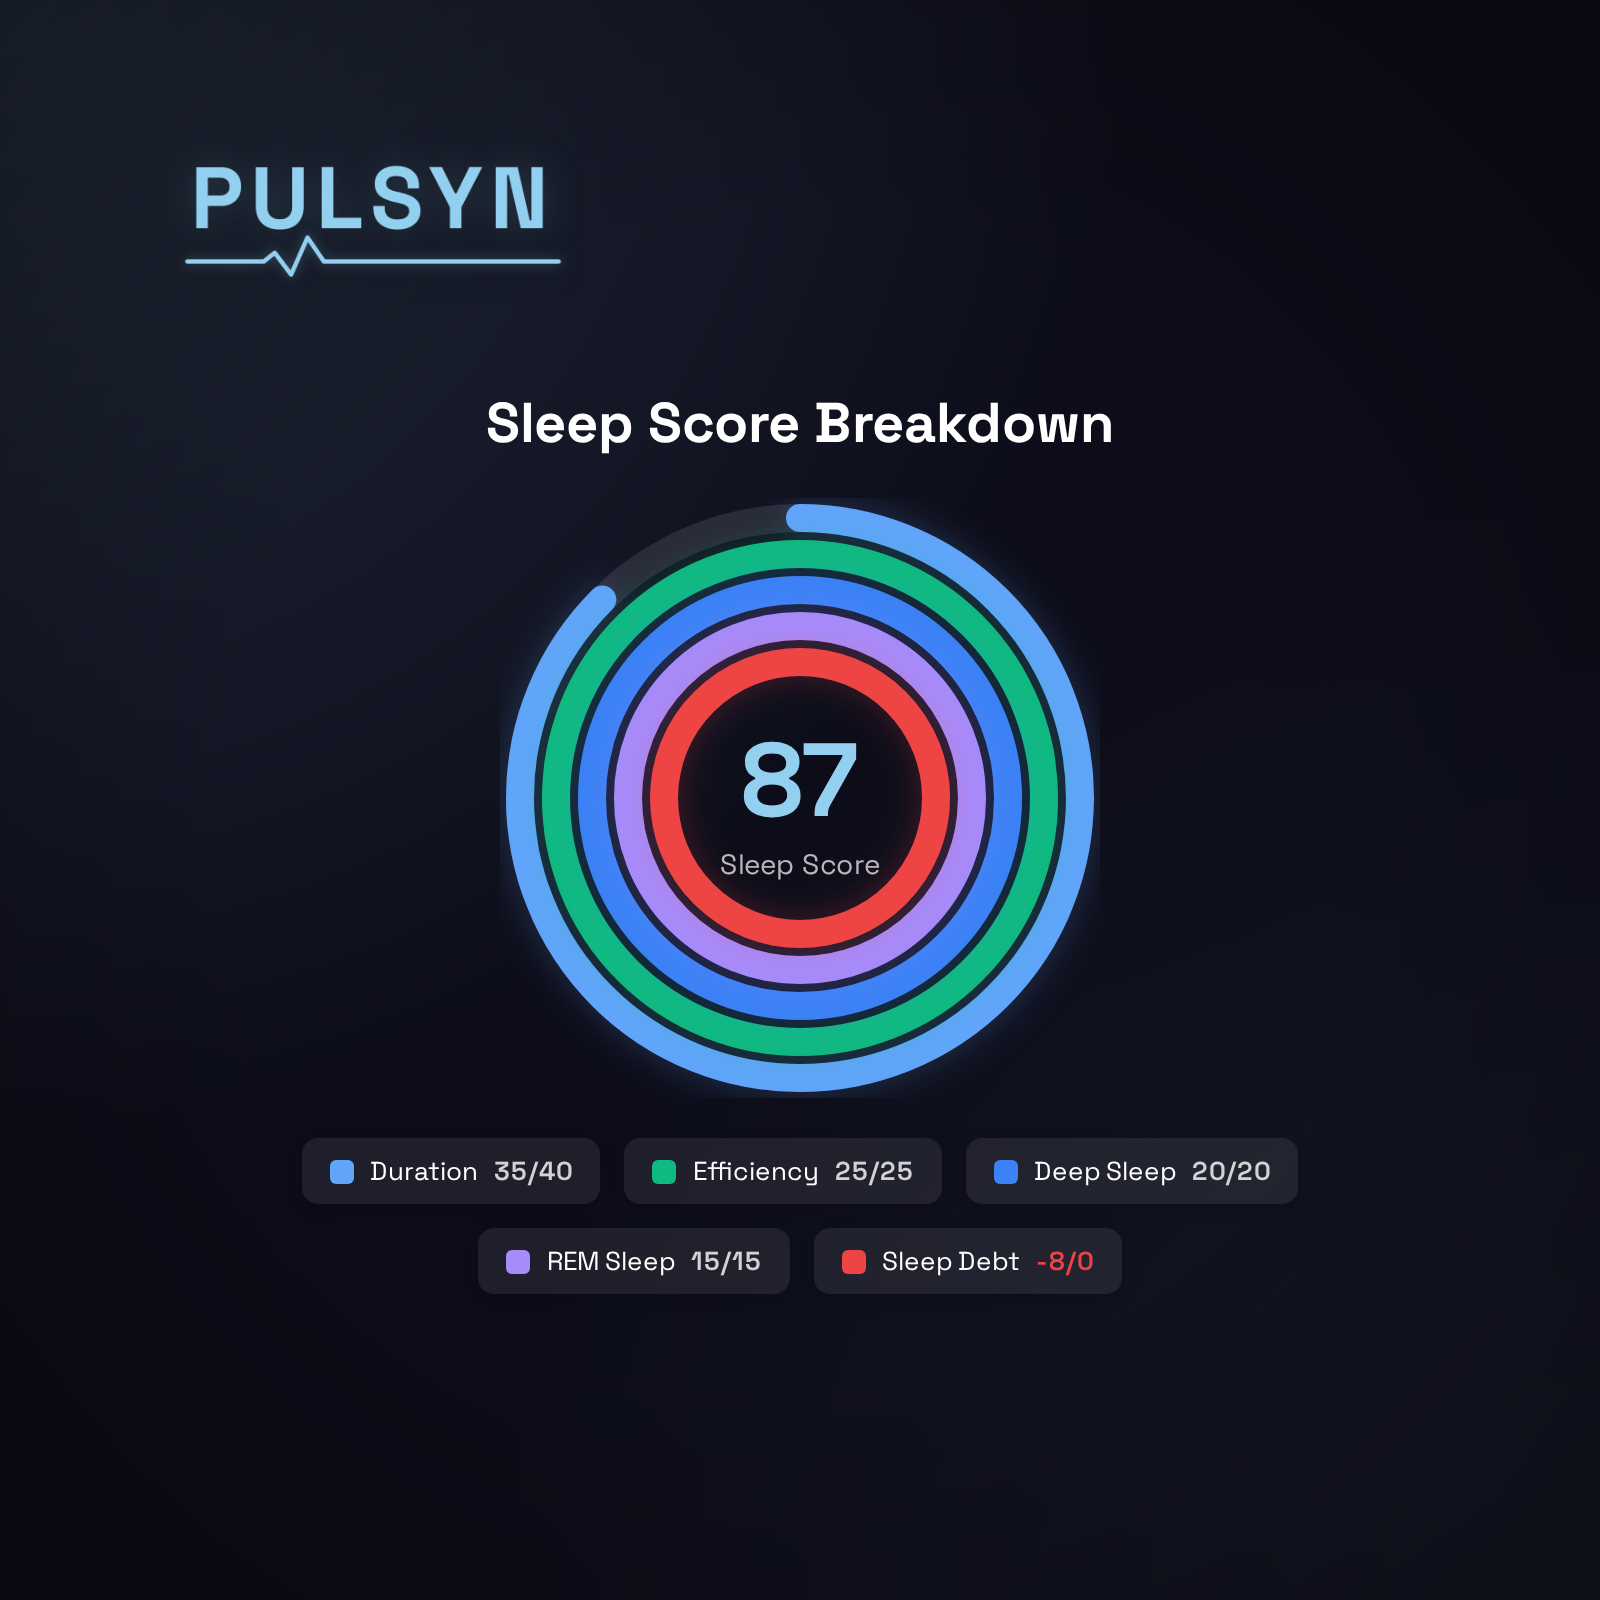
Score Calculation:
- Duration: 7h 20m vs 7.5h optimal = 0.33h deviation, scoring 35/40 points
- Efficiency: 440min / 480min = 91.7%, scoring 25/25 points
- Deep %: 21.5% vs 22% baseline (Z-score: -0.1), scoring 20/20 points
- REM %: 23.9% vs 23% baseline (Z-score: +0.2), scoring 15/15 points
- Sleep debt penalty: -1.5h debt applies -8 points
Final Score: 35 + 25 + 20 + 15 - 8 = 87/100 ✅ (Excellent)
Part 5: What We Don't Include (And Why)
Sleep Onset Latency
What it is: Time to fall asleep after lights out
Why we don't score it: The ring can't detect the exact moment you intend to sleep (vs reading in bed, watching TV). Including this would add too much noise.
Number of Awakenings
What it is: How many times you briefly wake during the night
Why it's already captured: The efficiency score accounts for this already. More awakenings = lower efficiency = lower score.
Circadian Alignment
What it is: Whether you sleep at your body's optimal time
Why we don't score it yet: Accurate detection requires weeks of baseline data and complex chronotype analysis. It's coming in a future update.
Part 6: Comparing to Competitors
Oura Ring Gen 4
Their approach: Population-based thresholds
- Penalizes short sleepers (genetic <6h need)
- Doesn't account for athletic recovery needs
- Fixed 7-9 hour optimal range
Pulsyn builds personalized baselines from your own data instead of comparing you against a population average.
Whoop 4.0
Their approach: Focus on sleep need vs sleep got
- Good concept, but relies on survey data (unreliable)
- Doesn't track multi-day debt
Pulsyn calculates your optimal duration from actual sensor data, and tracks cumulative debt across the full week.
Apple Watch
Their approach: Basic sleep staging without scoring
- No actionable score
- Limited deep/REM accuracy
- No personalization
Pulsyn publishes the full algorithm and adapts scoring to your individual baselines.
Frequently Asked Questions
Q: Why did my score drop even though I slept 8 hours?
A: Check your sleep debt and stage percentages. You may have accumulated debt from previous nights, or your deep/REM sleep could be below your personal baseline. The app's insights will break down which component brought the score down.
Q: How long until I get personalized baselines?
A: We need 14-30 days of consistent wear to build reliable baselines. Until then, we use population norms as a starting point.
Q: Can I see the raw algorithm code?
A: We document our algorithms in detail throughout this blog series. For specific implementation questions, contact us at james@getpulsyn.com.
Q: What if my optimal sleep is different from 7-9 hours?
A: That's the whole point. The algorithm discovers your personal optimal from your own data. If you consistently feel great on 6.5 hours, that becomes your baseline.
Q: How accurate is your sleep staging?
A: We achieve 85-90% overall accuracy compared to PSG (the gold standard). See "Validation Against Gold Standard" above for the per-stage breakdown.
Conclusion: Trust Through Transparency
We publish the full algorithm because opaque health scores aren't worth much. If you can see exactly how the number is calculated, you can decide whether to trust it, optimize against specific components, and compare it honestly against other trackers. That's the goal.
The algorithm has real limits. No finger-worn device matches EEG precision, and we say so plainly. But for tracking trends, catching deviations from your personal norm, and understanding the relationship between sleep and daily performance, the signal is solid.
About the Author
James Hoffmann is the founder of Pulsyn and a privacy-focused health technology engineer. I believe transparent algorithms and user data ownership are fundamental rights in health tracking.
References
- Walker, M. (2017). Why We Sleep: Unlocking the Power of Sleep and Dreams. Scribner.
- Chinoy, E. D., et al. (2021). Performance of seven consumer sleep-tracking devices compared with polysomnography. Sleep, 44(5).
- Altini, M., & Kinnunen, H. (2021). The Promise of Sleep: A Multi-Sensor Approach for Accurate Sleep Stage Detection Using the Oura Ring. Sensors, 21(13).
- National Sleep Foundation (2015). Sleep Duration Recommendations.
Image credits
- Photo by: kaluci
- Unsplash: https://unsplash.com/photos/YwxwvMfbfZs